Editing Node Dates
This guide details how to edit date values for nodes on the inspectors within your OrgChartX organizational chart.
Understanding Date Fields
OrgChartX provides eight dedicated Date fields for each node in your chart. These fields allow you to capture and display important date information specific to each element.
For in-depth details about the Date field functionalities, refer to the comprehensive guide on customizing fields.
Display Styles on Inspectors
The Inspectors panel in OrgChartX allows you to customize how date information is displayed for each node. You have two primary options:
-
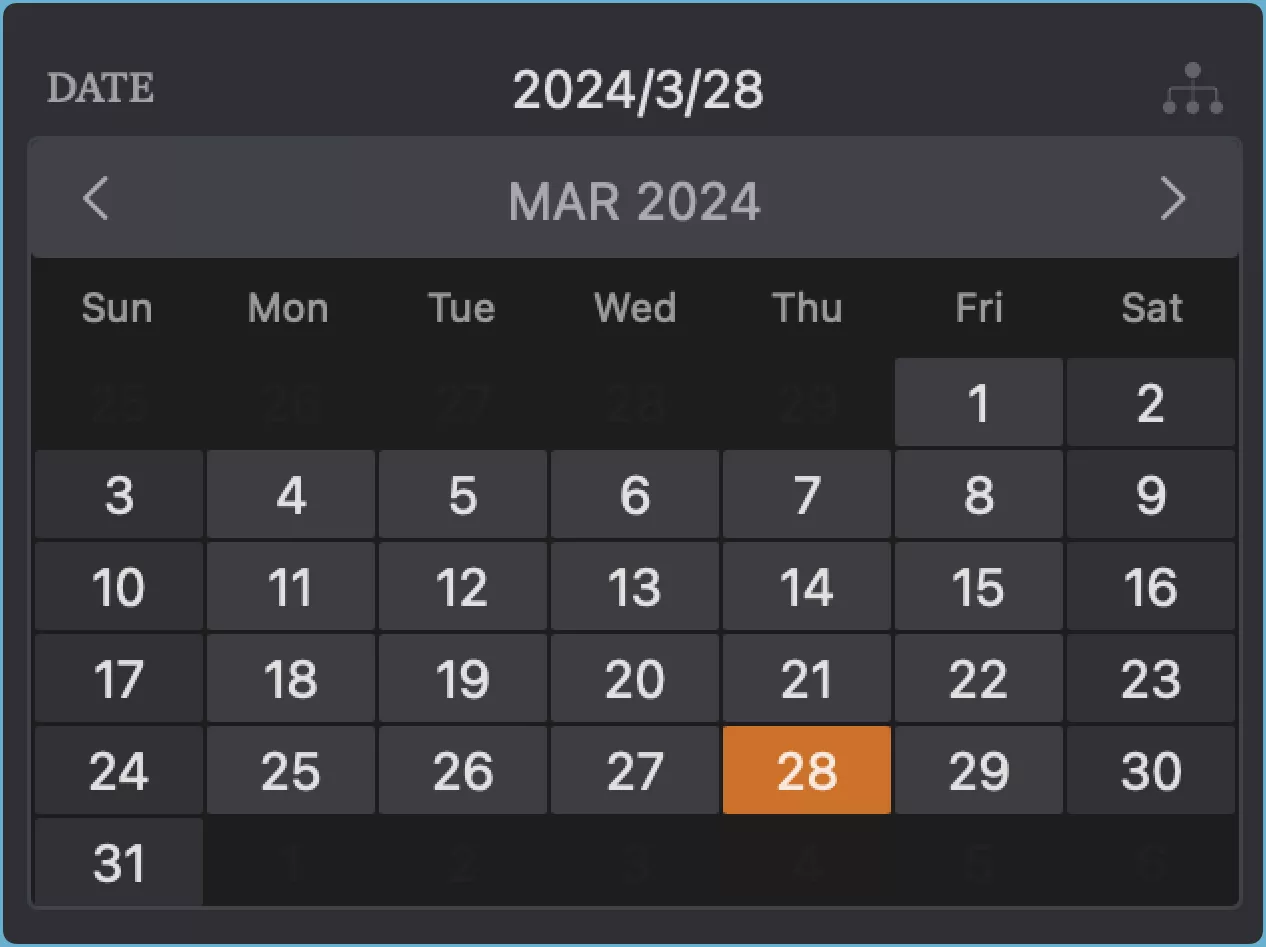
Graphics Style
This style uses an icon alongside the date text for a visually appealing representation.
-
Inline Style
This style presents the date information directly within the node itself

You can set the display style by tapping the title on top of this field.
Editing Date Values
To modify an the date value associated with a node:
- Simply tap directly on the
Datefield within the chosen node. - Enter the desired date using on-screen keyboard or date picker (depending on your device).
Additional Operations
Configure Date Field
Tapping the title of the Date field within the Inspectors panel unlocks further customization options:
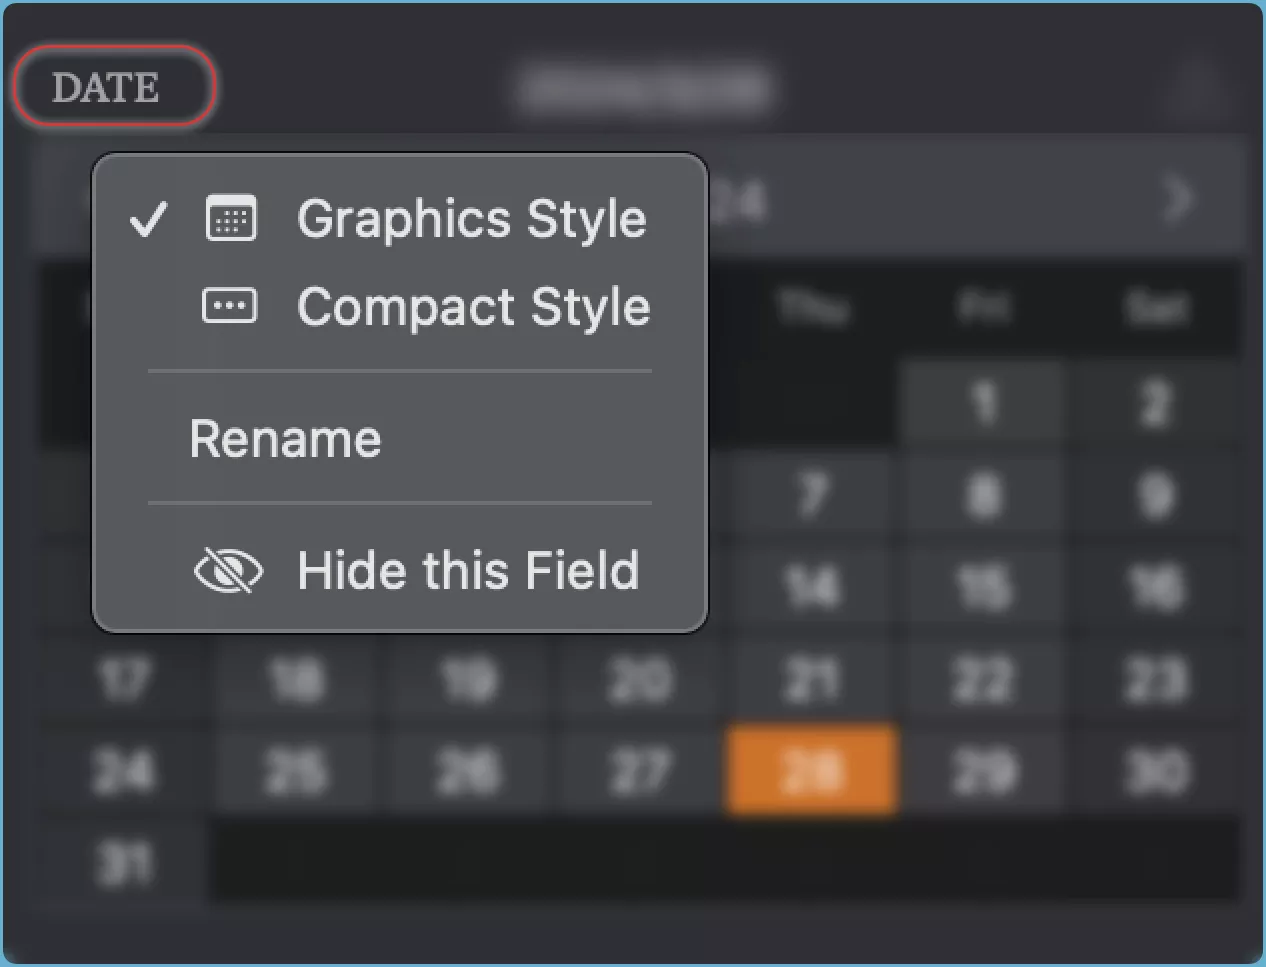
- **Change Display styles" - Quickly switch between the Graphics and Inline display styles as described above.
- Rename the field to match your preferences.
- Hide the field from the chart.
Show/Hide within Node on Chart
To control whether the value of this field is displayed in the node on the chart, tap the Tree button on the top right corner of this field. You will see a menu with the following options:
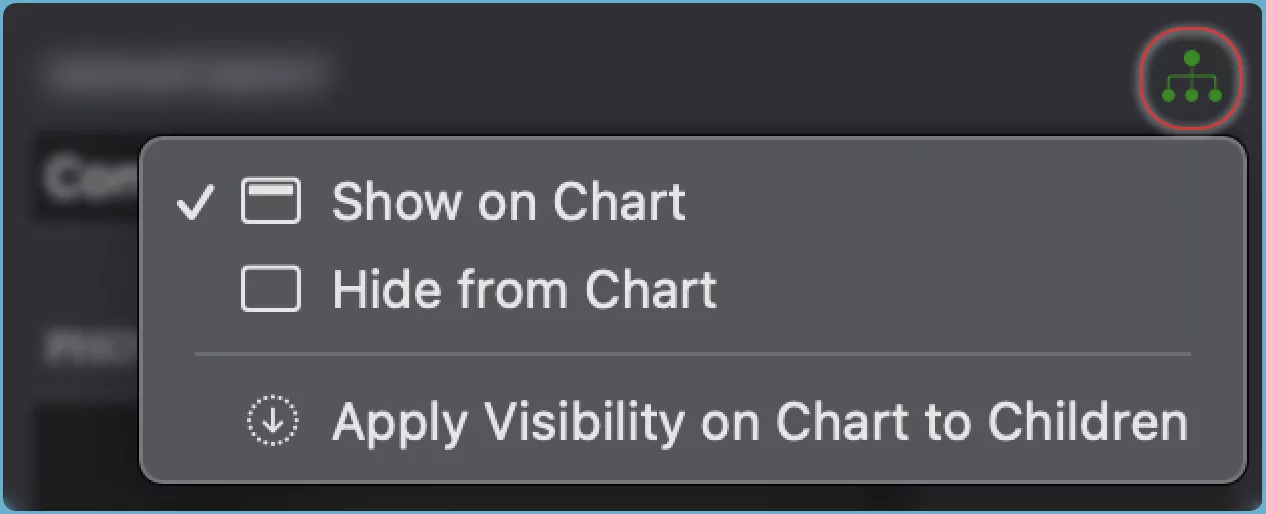
- Show the field value in the node on the chart.
- Hide the field value from the node on the chart.
- Apply to Children the same visibility setting for the field value to all the child nodes of the selected node.
TIP
See how to show or hide fields in the chart.