Understanding the OrgChartX Window
OrgChartX operates as a multi-window application. Each window displays and manages a single organizational chart, providing you with a dedicated workspace.
Organizational Chart Window
OrgChartX opens an organizational chart in a window to display and manage the components of a tree structure in list, chart, and column views. With the inspectors, you have the freedom to edit the node's properties and customize the node's display as you wish. The toolbar in the window provides the necessary buttons to change the document settings, export the document to CSV, image, and PDF files, switch the content view, lock the document, and more. In the app menu, you can find additional functions depending on the context.
Mac
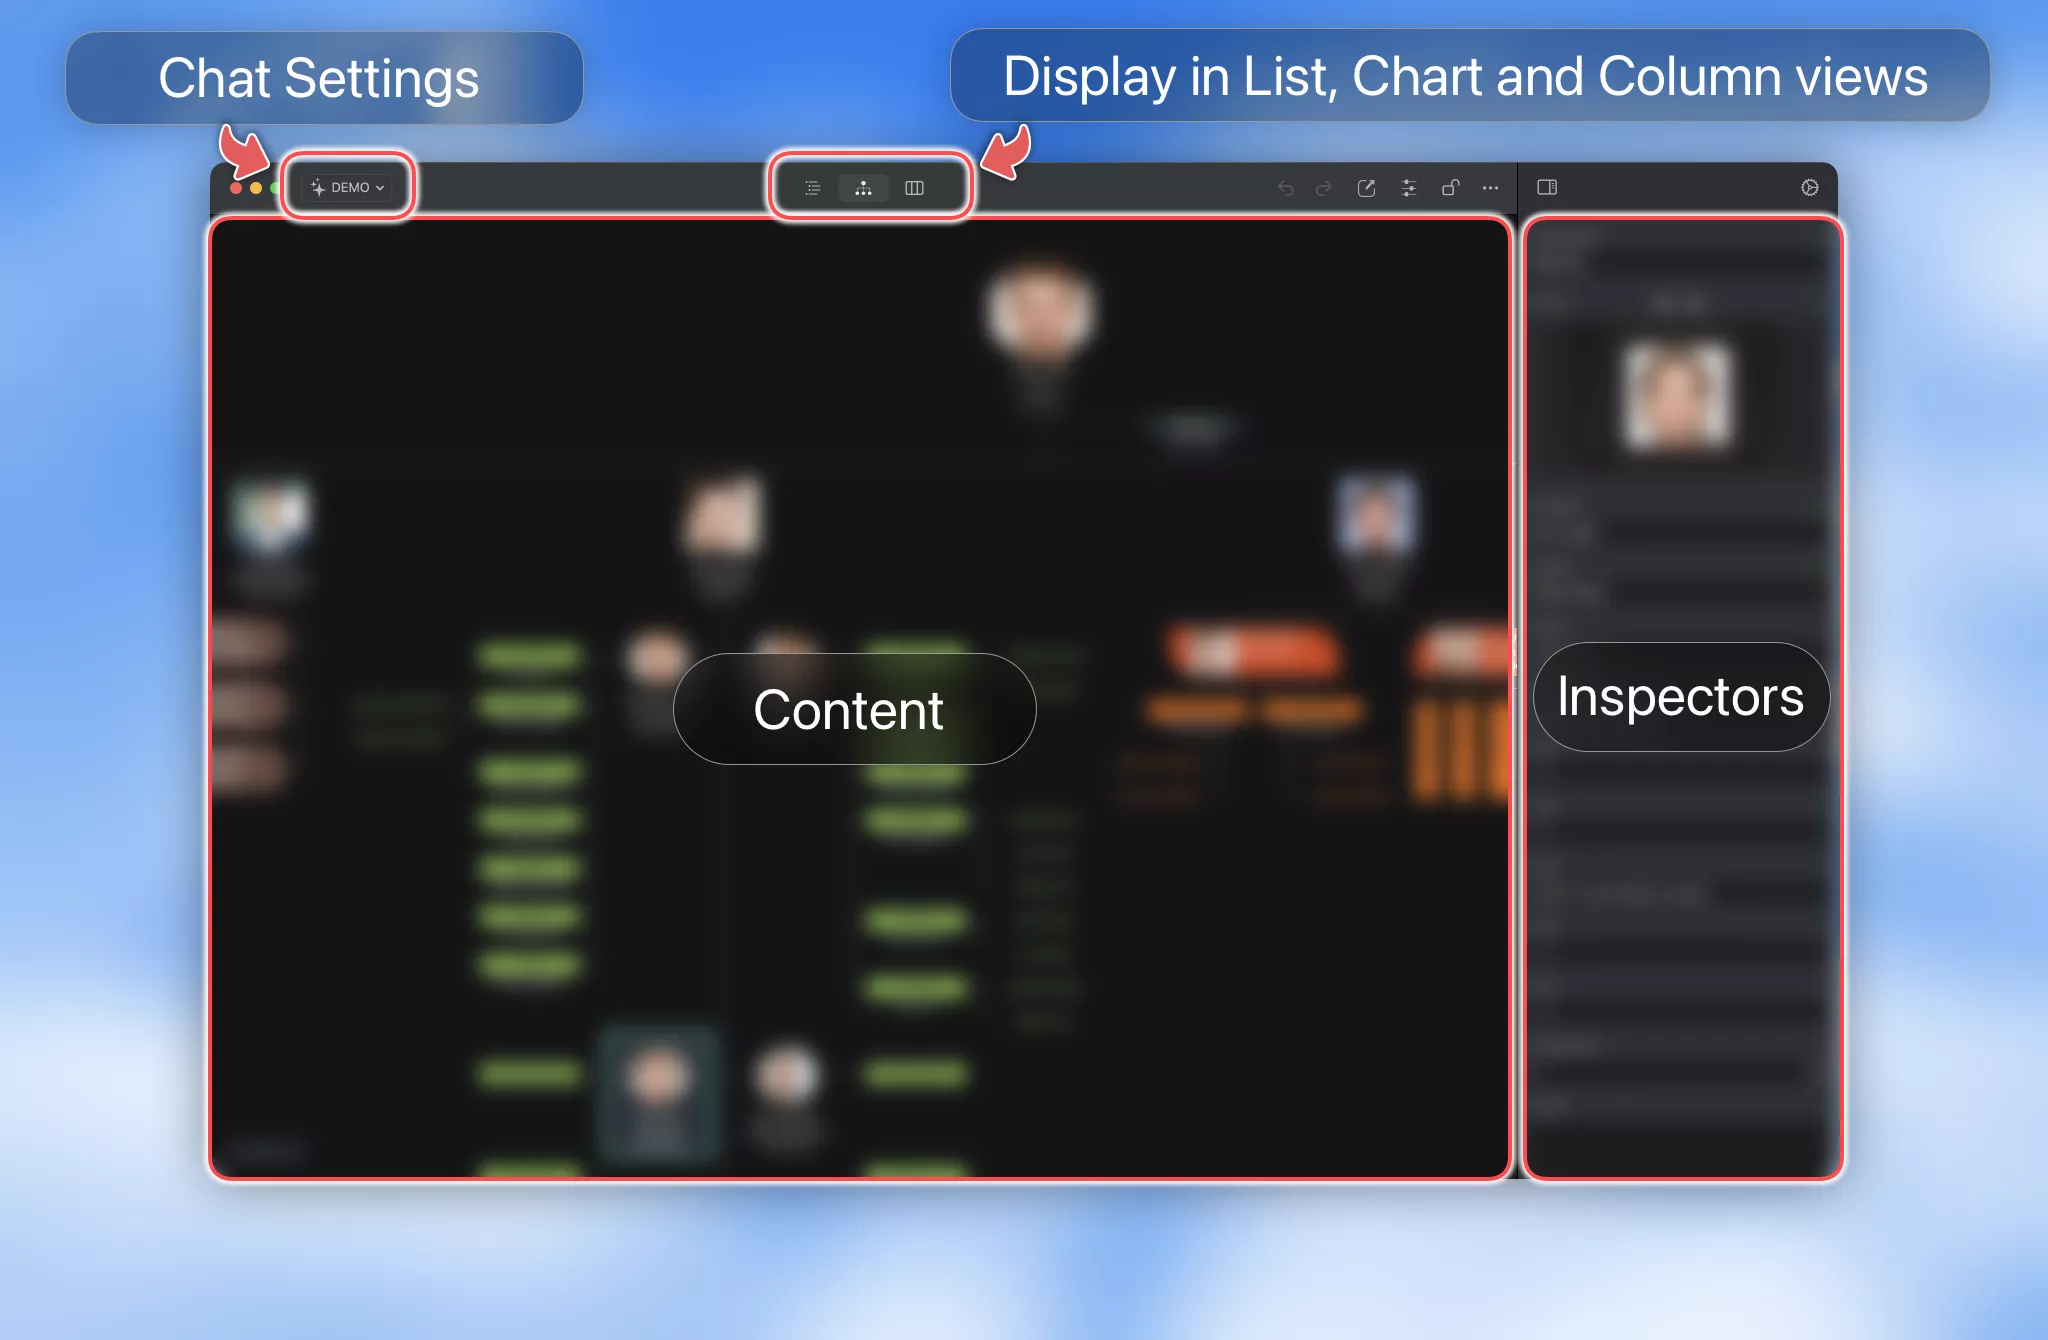
iPhone
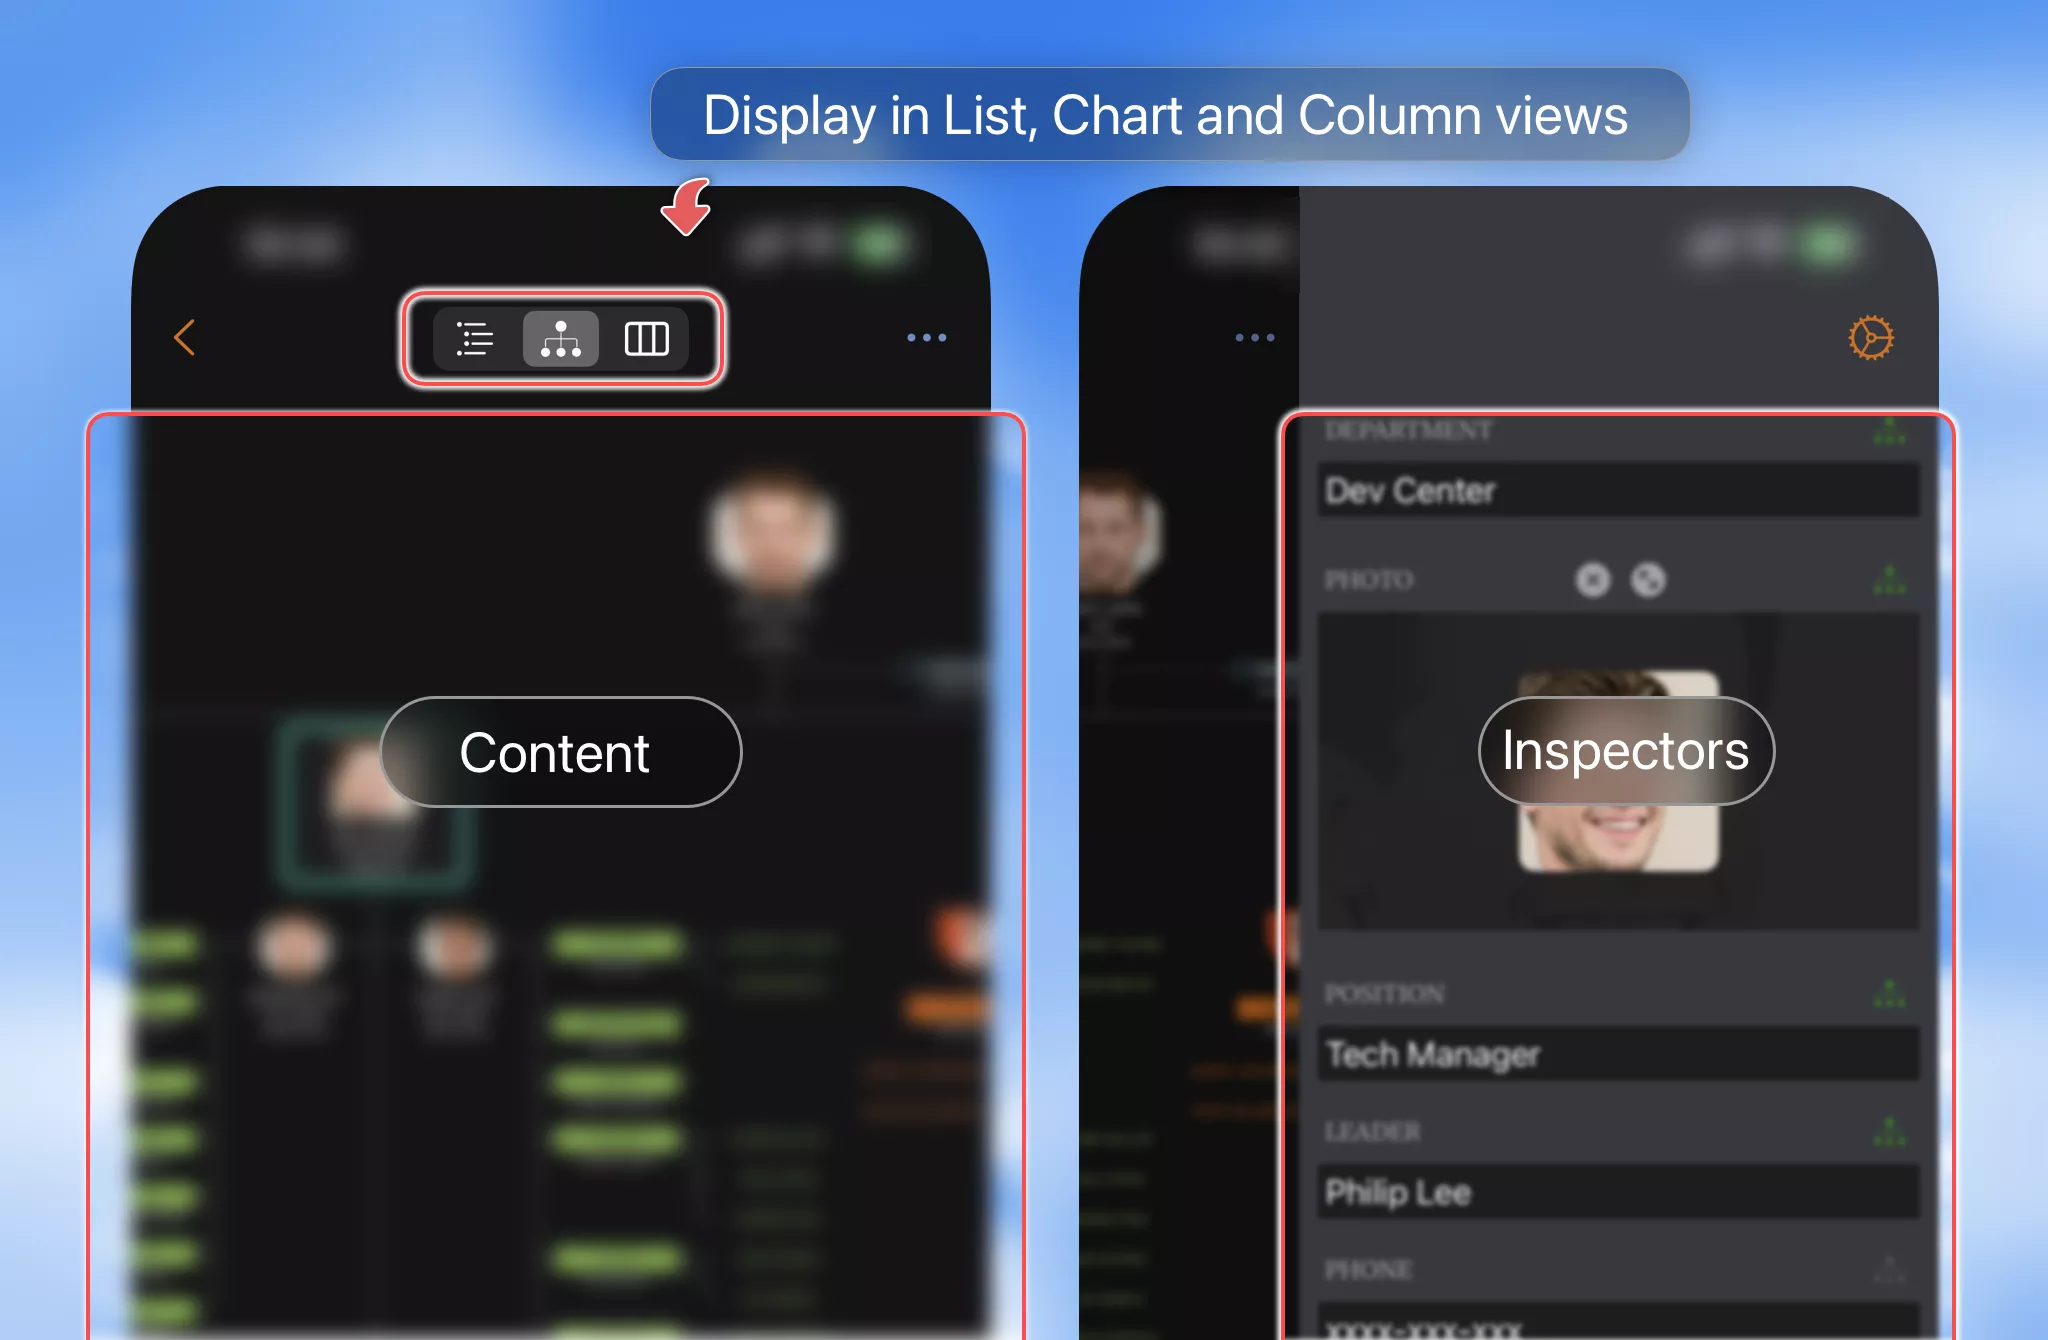
iPad
VisionPro
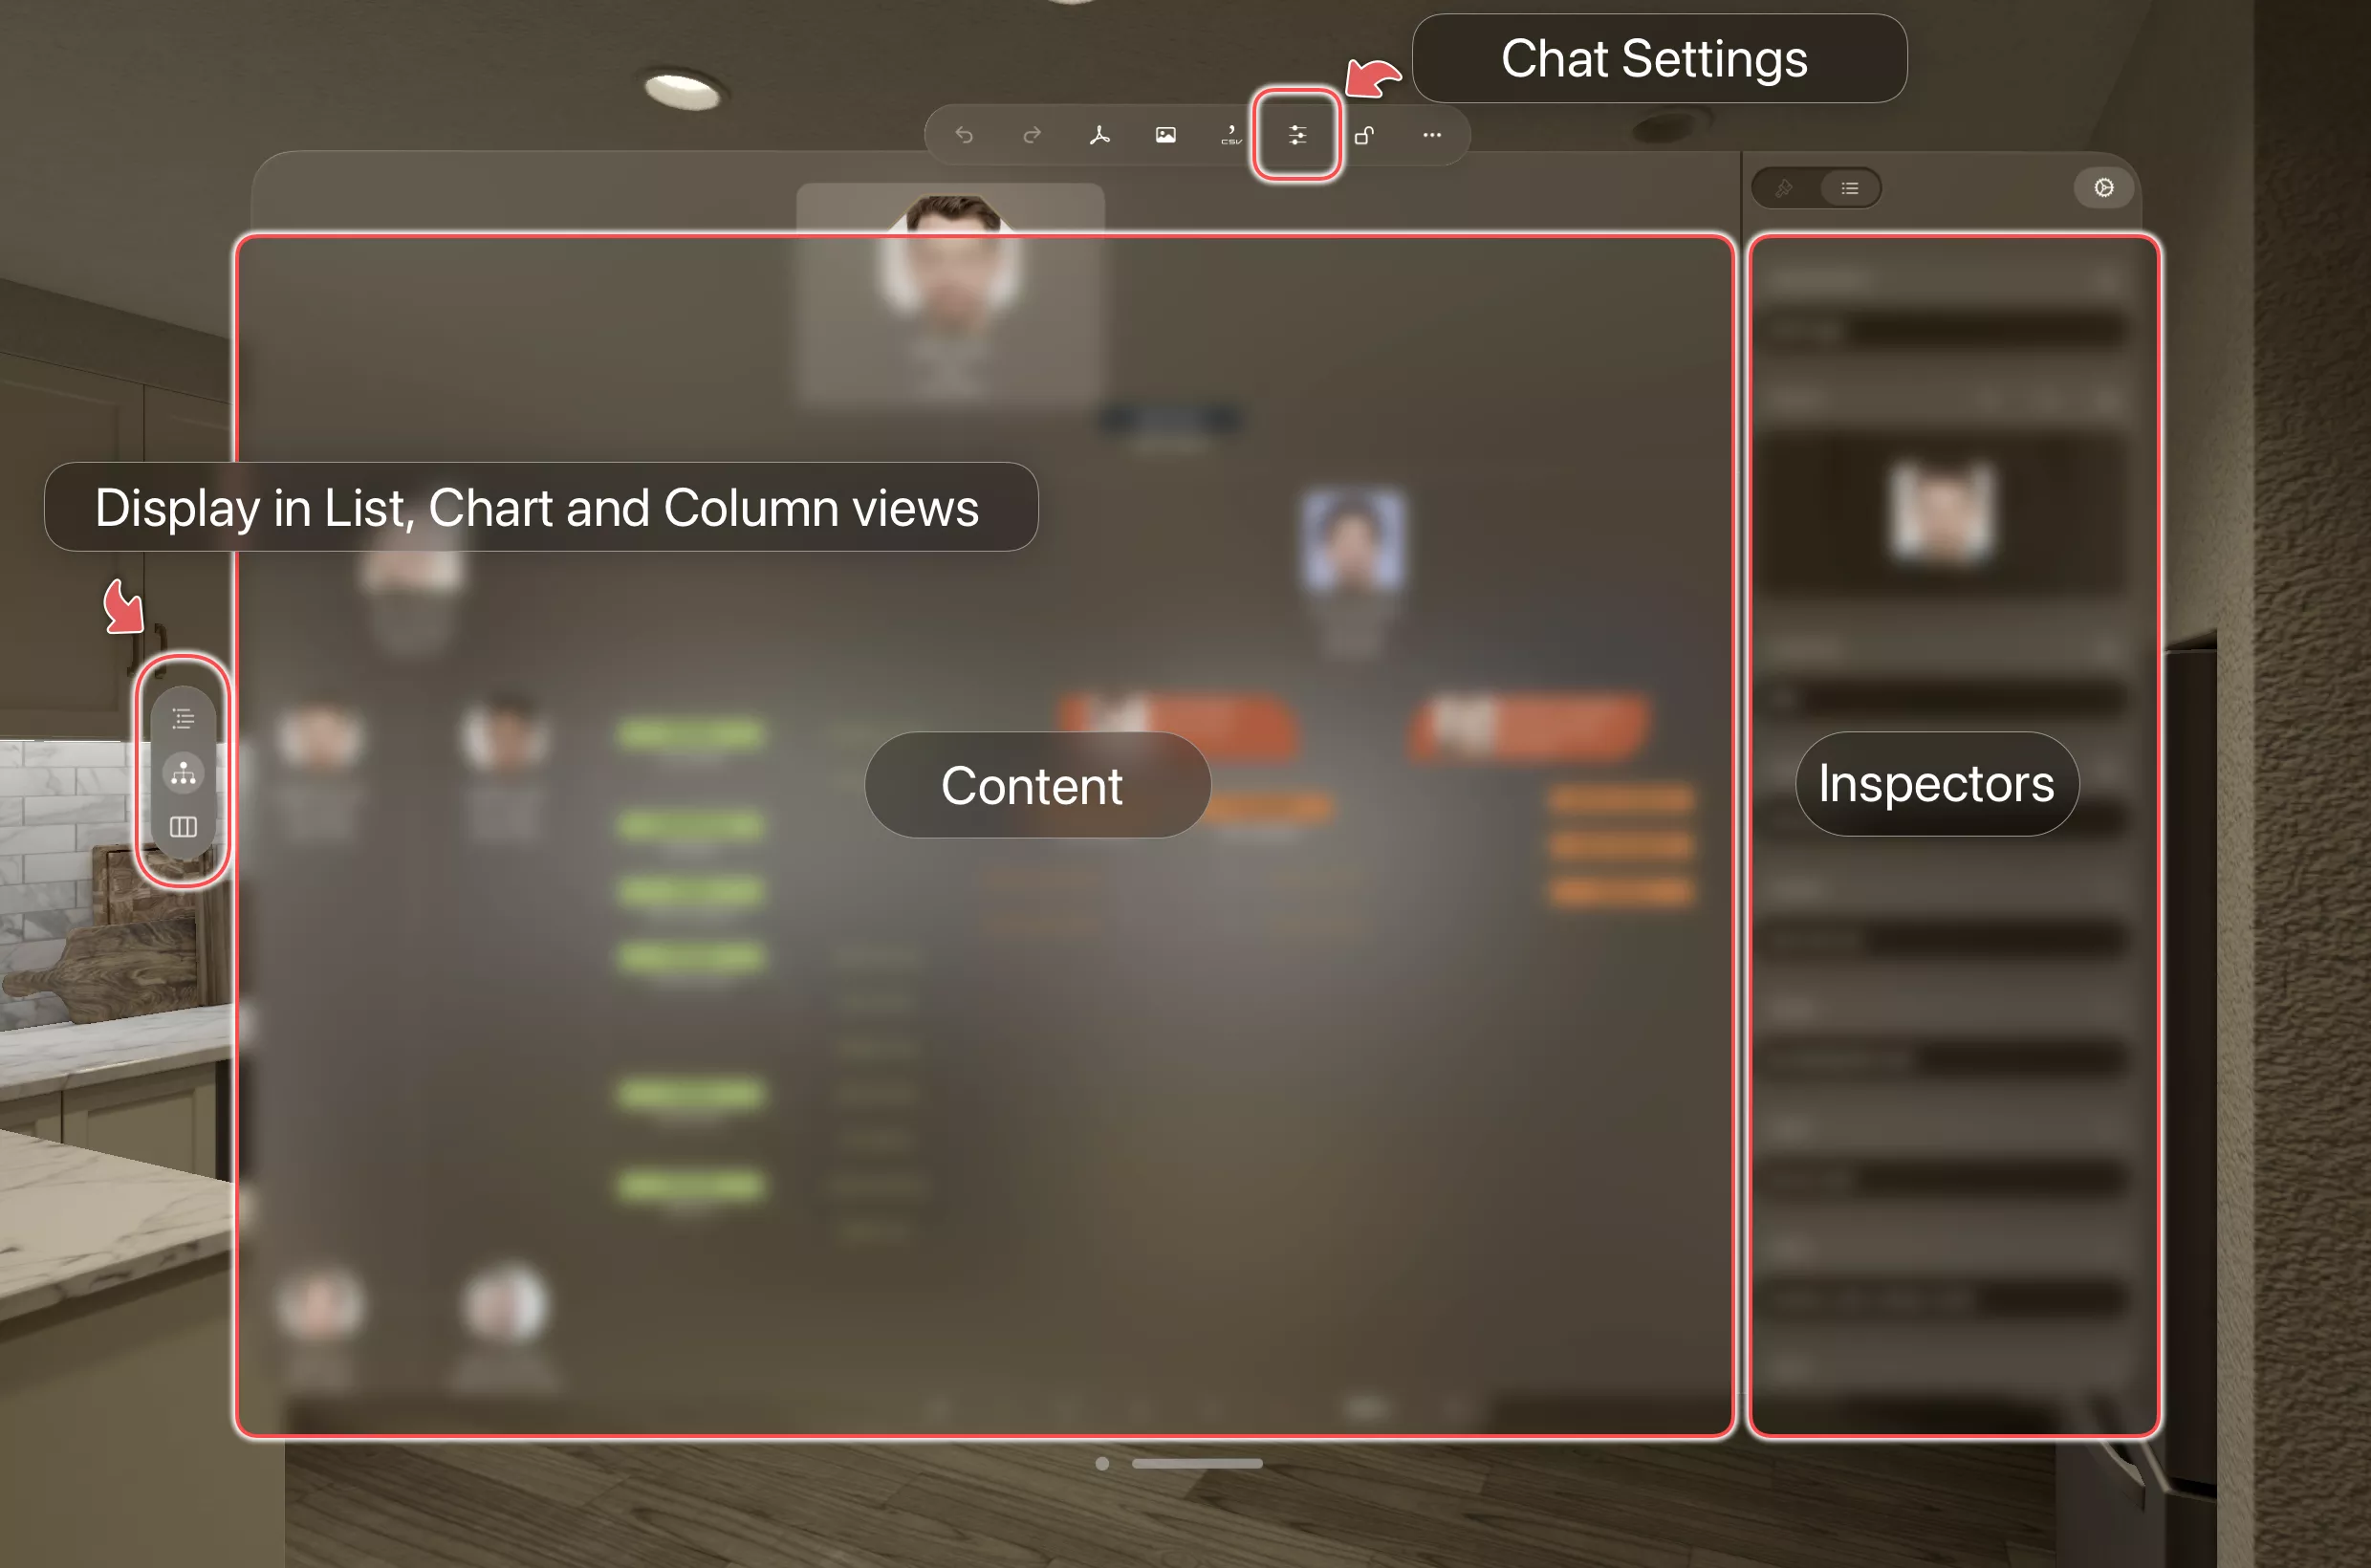
Grid View
The grid view acts like a simple Excel sheet. You can navigate between rows and columns and edit the selected cell.

Chart View
The chart view renders the organizational chart as expected by the definition of the visual nodes. You can zoom in and out, pan the chart view, and drag and drop nodes to rearrange the chart structure.
Column View
The column view is similar to the column view of the macOS Finder app. You can browse the hierarchy of the chart by selecting a node in each column.

Inspectors
The inspectors are the central place to edit the properties and display styles of the selected node. You can access the inspectors by tapping the "Inspector Toggle" button on the toolbar or by double-clicking on a node.
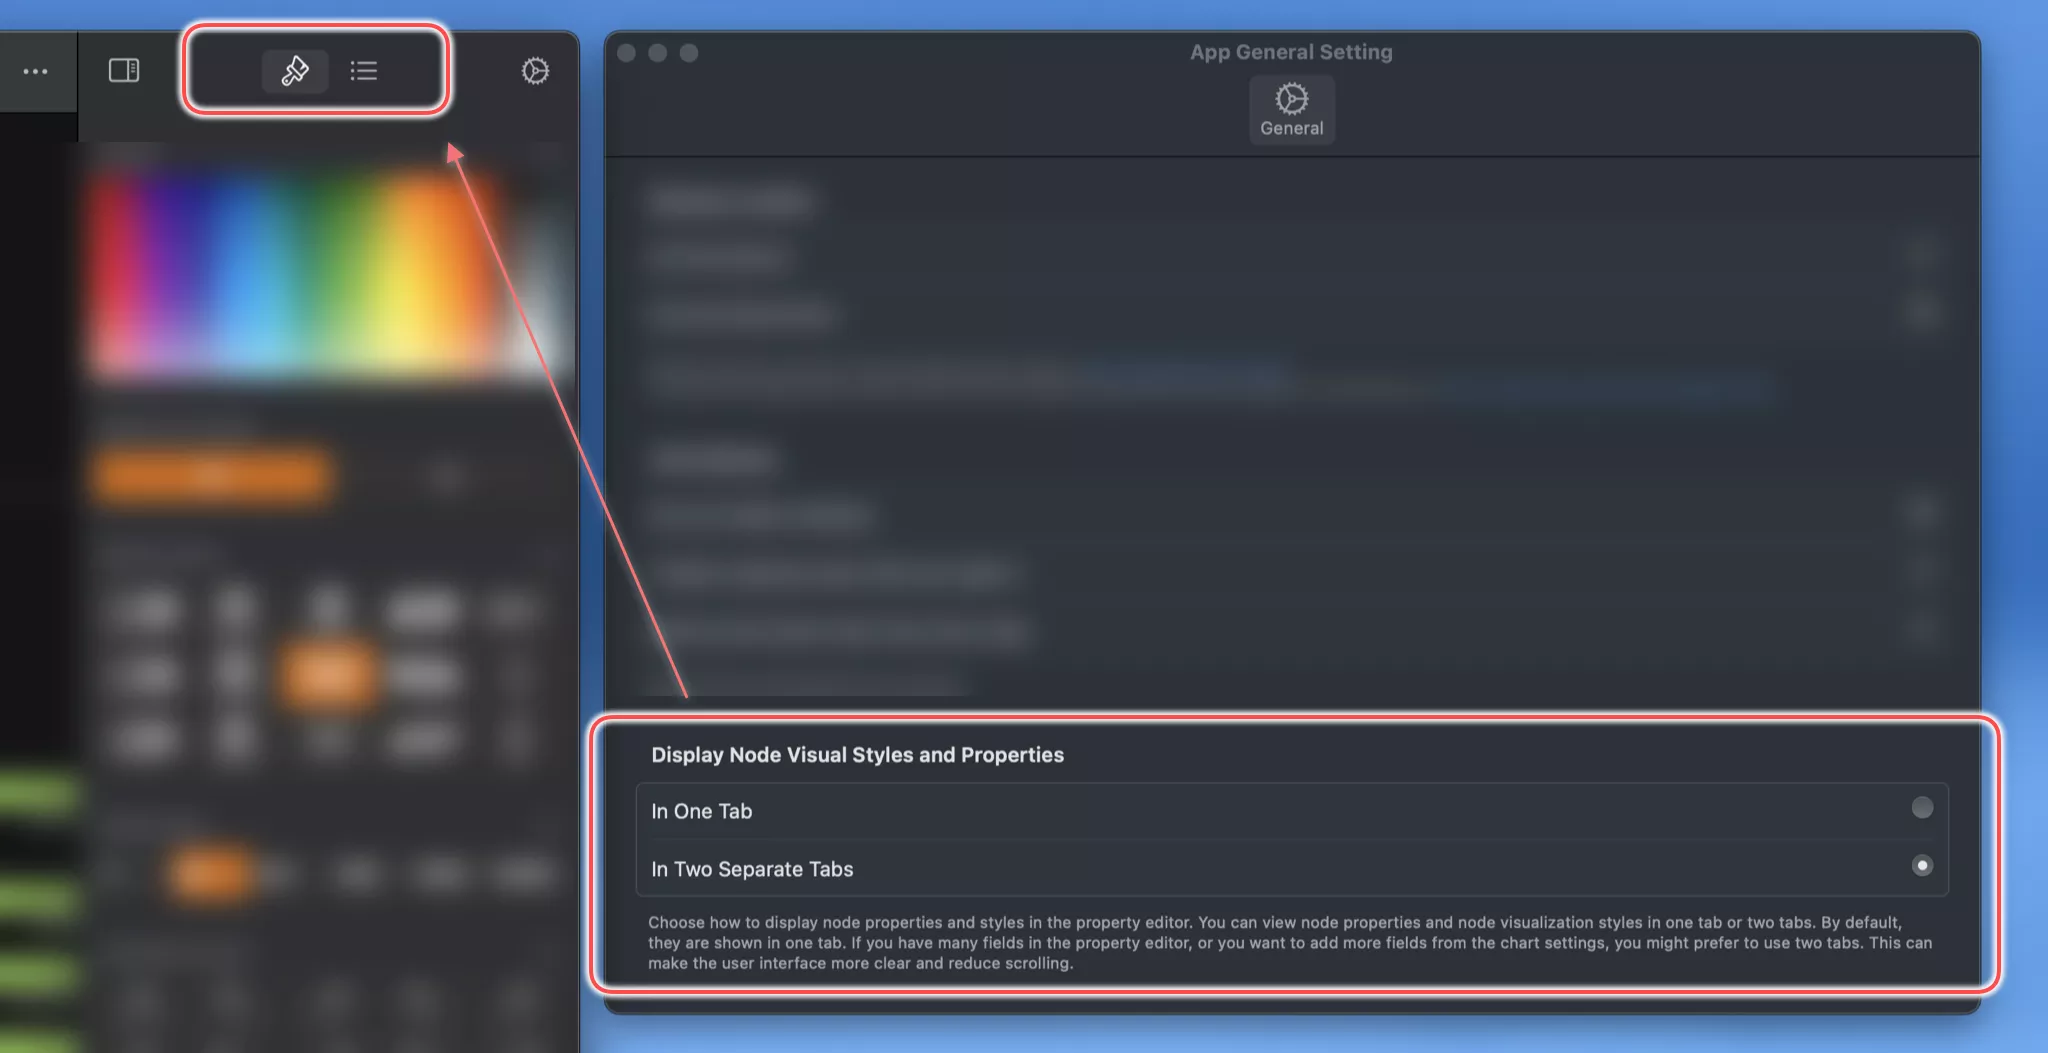
Show in One or Two Tabs
By default, the inspectors display the fields and visual elements of the selected node in one tab. If there are more fields that you have selected to use in the chart, to help you focus on your work, OrgChartX supports displaying the visual elements and field values separately in two tabs.
If you want to change to show them in two tabs, please go to the app's settings to set it.
